This page is intended as an appendix to the sediment segmentation model and the migration chart.
Twice-yearly monitoring of cliff loss under the present system began in 2003, and information on beach contour levels has been collected since 2008. The following content, drawn from digitalisation of the migration chart, spans a period of fourteen years, although a break occurs where one survey was missed because of poor weather.
A coastal length of 58.30 kilometres is covered, from Bridlington south to the neck of the Spurn peninsula (monitoring profiles 8 to 123). No monitoring of cliff loss is undertaken where there are defences against the sea, at Hornsea, Mappleton, Withernsea, and Easington, or across the lagoons south of Easington. Beach contour levels apply to the entire coast except for Hornsea and Withernsea groyne fields.
Cliff loss data are provided by monitoring profiles, notional lines along which measurements are taken. With two exceptions, profiles are spaced at approximately 500 metre intervals, crossing the cliff edge at right angles (details). They in fact represent sampling points in the observation of landward recession, and may not necessarily record a maximum loss locally (details).
Brief descriptions of monitoring locations are supplied at data summary and coordinates (spreadsheet).
- View locations of monitoring profiles in satellite imagery
- load Google Earth
- right click Temporary Places > Add > Network Link
- at Link, insert
https://urbanrim.org.uk/GE-monitoring-locations.kml - OK
- click on Untitled Network Link
- Pins Pr1 to Pr123 mark cliff top positions of monitoring profiles
- Pins EP1 to EP120 mark locations of erosion posts (former system)
- circled dots mark cliff top positions in 2003
In order to present a more workable relationship between cliff loss and beach conditions, attention is expanded to the profile section. This refers to the length of coast on both sides of a monitoring profile.
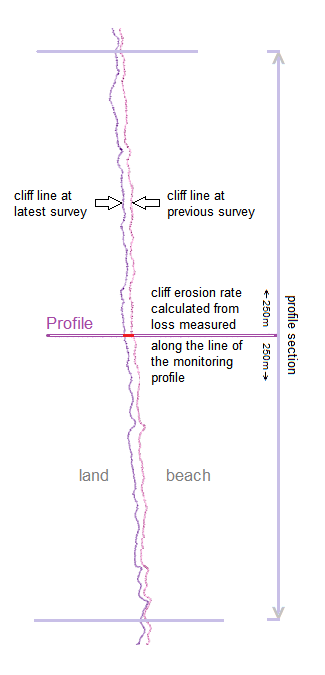
For the purposes of the study, profile sections are assigned the cliff loss value of the monitoring profile to which they belong, and considered against the beach types that run parallel to, or ‘opposite’, the section, in part or completely.
Beach levels are recognised as those at and around the base of the cliff at the time survey. A high or full beach lies above a minimum 2.5 metres OD (Ordnance Datum), a low or thin beach below a maximum 1.5 metres OD. An intermediate beach occupies the range between the two. (The senses of full and thin relate to depth, or perhaps absence of, a sediment layer on an underlying clay platform.)
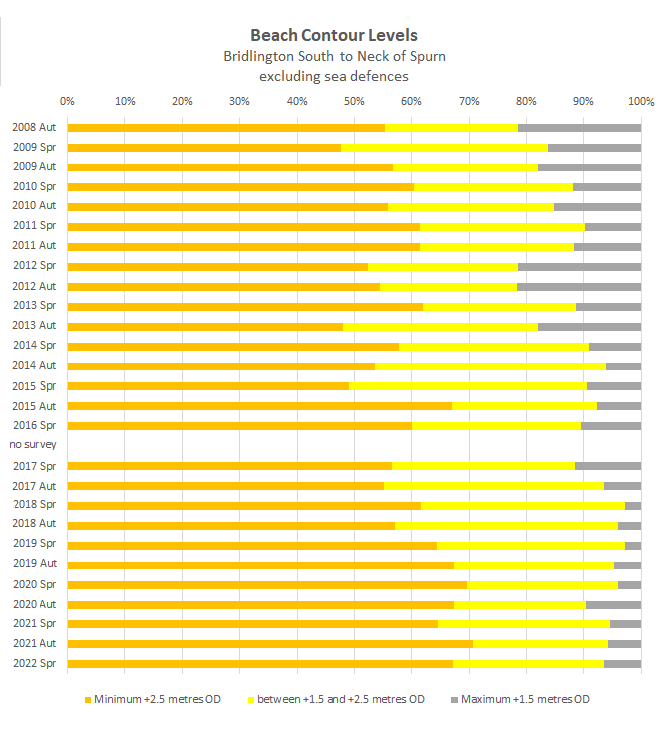
Mostly, a little over half the coastal length displays a high beach. The extent of high beach has slightly increased and low beach reduced over the period 2008 to 2021.
Throughout the same period, the trend in the annual rate of cliff loss for the undefended coast remains essentially even.

Data from the previous system of physical cliff loss monitoring, using erosion posts (EPs), produce an upward trend over a longer term. The rise, though, is far from smooth. There are ‘flat’ spells similar to the recent experience.
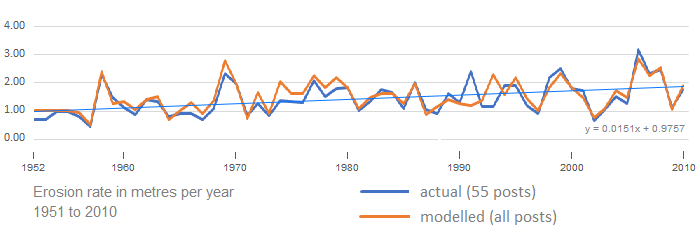
[The chart displays one trace for locations for which records are complete or very nearly so, and another trace that represents all 120 EPs with the remainder modelled from information that exists. A difference in formulation of irregular survey dates causes brief misalignment around 1991 to 1993.]
A full upper beach offers some protection against wave energy. In quieter weather, high tide often does not reach the foot of the cliff.
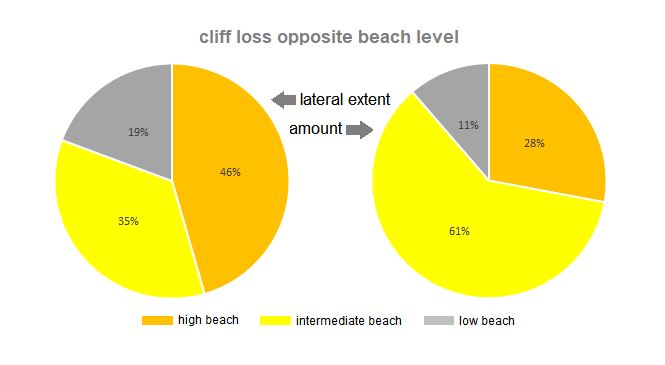
Laterally (along the coast), a little over one half of cliff loss occurs where the beach is less than full. Cliff recession where beach is high might be a consequence of erosion lag. See direct and delayed erosion.
In terms of amount, or volume of material, almost three-quarters of loss is opposite a beach less than full.
effects of sea level rise (SLR)
Although data specific to the East Yorkshire coast are not available, average mean sea level, relative to any land movement, is rising all around the UK, and the rate of change is increasing. The following chart provides a general perspective.
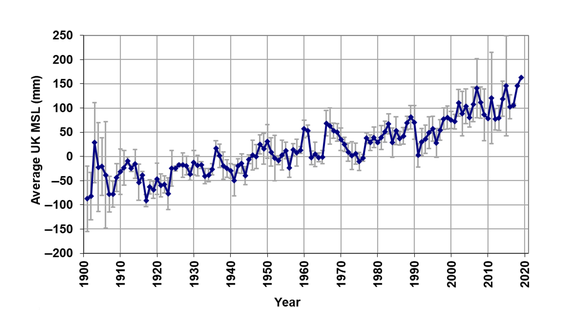
[State of the UK Climate 2020, M. Kendon, M. McCarthy, S. Jevrejeva, A. Matthews, T. Spark, and J. Garforth, International Journal of Climatology, Special Issue Article, published July 2021 (see Section 6).]
This does not necessarily mean the sea is getting deeper at the cliff base. According to the Bruun Rule, named after Per Bruun, a Danish-American coastal engineer, the cross-beach profile tends to respond to sea level rise by adjusting to the former relationship. A state of equilibrium is maintained, with the beach shifting landward and very slightly upwards as the cliff erodes.
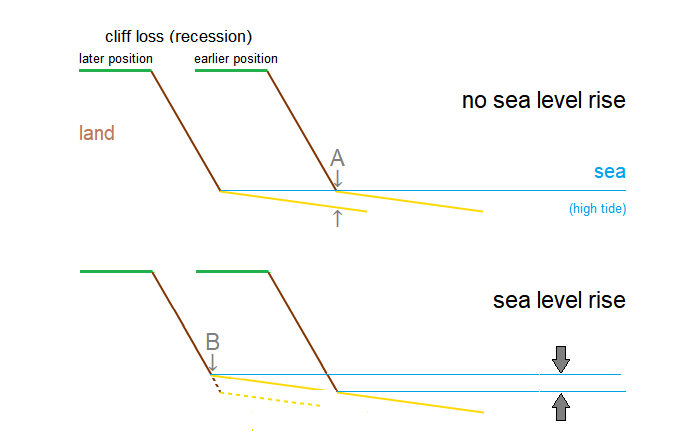
If sea level were to remain constant, the land-cliff-beach profile would shift horizontally landward as the cliff line recedes. Beach level at point A, the cliff foot at an earlier position, would drop for the later position. An example is shown at the page for Hollym, where the once buried Withernsea sewage outfall pipe became exposed. At Barmston, the seaward end of the outfall casing was undercut as beach profile level shifted landward.
On each rise in sea level, the overall profile is maintained but is lifted very slightly as it moves landward (scale in the figure is exaggerated for emphasis). At point B, beach level is higher in respect to datum and the sea reaches further up the cliff face while the relation between components remains the same (i.e. in equilibrium). Sediment to enable the rise in beach level comes from eroded cliff material. In its simplest form, the Bruun Rule proposes that the two quantities are equal.
In the case of the East Yorkshire coast, any effects of sea level rise on the beach profile at a particular location are tiny compared to those brought about by annual variation and sediment migration. For the coast as a whole, however, and over a time scale, some influence may be discernible.
As seen in the Beach Contour Levels chart above, the spread of high beach is on the increase, and low beach on the decrease. This would indicate a small rise in beach level commensurate with sea level rise, as suggested by the Bruun Rule. (Eventually, since Ordnance Datum is a fixed level, the minimum and maximum parameters for deciding high and low beach will need to be revised.)
Also depicted above, the average annual rate of cliff loss over the same period remains little changed. Theoretically, sea contact with the land is made fractionally higher up the cliff but, as the water is no deeper at the cliff base because of a corresponding rise in beach contour level, this itself has little direct impact on the rate of recession.
On the other hand, there is an increased threat of overtopping and flooding in lower lying areas when sea levels rise. It may be argued, too, that a higher mean level across the North Sea basin could have implications for factors such as wave characteristics, and storm energy. These would contribute to coastal erosion.
data for this page (spreadsheet)
all cliff loss data (menu)
top
more on East Yorkshire coastal erosion
home
Prepared by Brian Williams in August 2020. Last update December 2022.


