This page is intended as a supplement to the data summary and the data in detail pages.
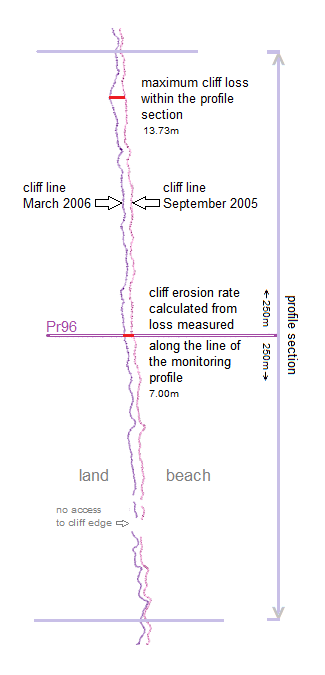
By the term cliff line is meant the top edge of the cliff, where land comes to an end.

Published erosion tables based on the monitoring profile plan are compiled from measurements taken along the actual line of the profile (Pr96 in the example).
Sometimes a maximum loss may be quoted. Not to be confused with the biggest value against a profile in the tables, this is the greatest difference between cliff lines of two consecutive seasons observed within the profile section.
Each section extends laterally either side of the profile line typically for 250 metres, making the section 500 metres in all.
Listed below are recorded incidences of maximum cliff loss.
Data are supplied by East Riding of Yorkshire Council.
◀ smaller screens ▶
profile number and location
metres
date
2
3
4
5
6
7
8
9
10
11
12
13
14
15
16
17
18
19
20
21
22
23
24
25
26
27
28
29
30
31
32
33
34
35
36
37
38
39
40
41
42
43
44
45
46
47
48
49
50
51
52
53
54
55
56
57
58
59
60
61
62
63
64
65
66
67
68
69
70
71
72
73
74
75
76
77
78
79
80
81
82
83
84
85
86
87
88
89
90
91
92
93
94
95
96
97
98
99
100
101
102
103
104
105
106
107
108
109
110
111
112
113
114
115
116
117
118
119
120
121
122
123
North of Bridlington defences [ data starts at 2003 ]
Bridlington frontage
Bridlington frontage
Bridlington frontage
Bridlington frontage
Bridlington frontage
South of Bridlington defences
South Shore holiday village - Wilsthorpe
South end of Wilsthorpe
North of Auburn Farm
Opposite Auburn Farm [ data starts at 1908 ]
South of Auburn Farm [ data starts at 1908 ]
North of Earls Dyke - Barmston
South of Earl's Dyke - Barmston
Watermill Grounds - north of Barmston
Opposite Hamilton Hill - north of Barmston
North of Barmston Beach holiday park
South of Sands Lane - Barmston
Opposite Barmston outfall
Opposite Brickdale - south of Barmston
North boundary of Seaside caravan park - Ulrome
South end of Seaside caravan park - Ulrome
Opposite Southfield Lane - Ulrome/Skipsea
North end of Green Lane - Skipsea
South of Green Lane - Skipsea
Opposite Skipsea
Cliff Road (Hornsea Road) - south of Skipsea
South of Skipsea Withow
Golf course - north of Skirlington
North end of Low Skirlington caravan park
Within Low Skirlington caravan park
South end of Low Skirlington caravan park
North end of Long Lane - Atwick
Opposite Long Lane - Atwick
Opposite Cliff Road - Atwick
South of Atwick
North of Atwick Gap (boat club ramp) - Hornsea
North end of Cliff Road - Hornsea
South of Nutana Avenue - Hornsea
North end of Hornsea frontage
Hornsea frontage
Hornsea frontage
Hornsea frontage
Caravan park to south of defences
South of Hornsea
Rolston firing range
Opposite Rolston
South end of former holiday camp - Rolston
North of Mappleton
Mappleton (defences since 1991)
South of Mappleton
Between Mappleton and Cowden
North of Eelmere Lane - Cowden
South end of Cowden
North end of MOD site - Cowden
Within MOD site - Cowden
Within MOD site - Cowden
Within MOD site - Cowden
South end of MOD site - Cowden
South of MOD site Cowden
North of Aldbrough
South of Aldbrough
North of Hill Top Farm - south of Aldbrough
South of Hill Top Farm - south of Aldbrough
Opposite East Newton
Between East Newton and Ringbrough
Opposite Ringbrough
South of Ringbrough
South of Ringbrough
North of Garton
South of Garton
Opposite Grimston Park
South of Grimston Park
North of Hilston
Opposite Hilston
North of Pastures Lane - Tunstall
North end of Pastures Lane - Tunstall
Opposite Pastures Lane - Tunstall
North of Tunstall
South of Tunstall
North of Sand le Mere holiday village
South of Sand le Mere holiday village
South of Sand le Mere
Opposite Redhouse Farm - Waxholme
North of Waxholme
South of Waxholme
Between Waxholme and Withernsea
North of Withernsea defences
Withernsea frontage
Withernsea frontage
Withernsea frontage
Withernsea frontage
South of Turner Avenue - Withernsea [ data to 2019 ]
South of Golden Sands holiday park - Withernsea
North of Intack Farm - Hollym
Opposite sewage works off Holmpton Road
North of Nevilles Farm - Holmpton
North of The Runnell - Holmpton
North of Holmpton village
Opposite Holmpton village
South of Holmpton village
South of Holmpton village
North of Out Newton
Opposite Out Newton
South of Out Newton
Dimlington High Land
South of Dimlington High Land
Between Dimlington High Land and Easington
North of Easington [ data from 2024 ]
Easington [ data to 1998 ]
Easington [ data to 1998 ]
South of Easington
Opposite Seaside Road - Easington
Easington/Kilnsea lagoons [ data to 1994 ]
Easington/Kilnsea lagoons [ data to 1994 ]
Easington/Kilnsea lagoons [ data to 1994 ]
South end of lagoons - Kilnsea
North of Godwin Battery site - Kilnsea
South of Blue Bell - Kilnsea
Between Kilnsea and Spurn
North end of Spurn [ data to April 2023 ]
Neck of Spurn peninsula
1.81
3.60
2.47
1.91
6.40
11.81
7.92
9.62
10.17
11.29
9.84
7.54
12.25
12.48
9.66
11.18
10.22
9.26
9.36
10.17
10.95
11.60
9.82
8.11
11.50
15.66
12.00
11.64
10.78
8.95
10.97
13.99
10.03
5.82
1.60
9.66
10.83
10.15
9.88
8.94
9.80
10.06
11.05
10.28
11.66
15.07
17.99
11.22
10.60
10.92
14.52
14.11
11.01
13.55
14.92
16.18
11.23
13.85
14.34
12.87
12.45
11.55
14.20
13.62
14.56
12.44
14.11
13.10
12.68
10.91
11.02
10.81
11.08
18.38
22.68
14.32
9.95
9.75
14.49
9.10
10.49
14.31
22.39
23.79
20.93
18.74
17.82
13.47
12.90
10.47
17.14
13.14
13.83
14.92
16.33
14.22
11.54
14.82
7.67
9.91
7.88
12.25
16.01
8.29
lost
April 2011
1890 to 1907
1891 to 1907
1892 to 1907
December 2013
December 2013
December 2013
May 2018
May 2024
December 2013
May 2024
September 2007
December 2013
March 2008
March 2004
May 2024
May 2024
May 2024
March 2007
March 2008
April 2011
April 2013
March 2020
March 2016
May 2024
May 2024
May 2018
April 2021
May 2024
May 2024
April 2013
March 2008
April 2011
September 2005
1853 to 1890
March 2020
September 2004
March 2022
March 2004
March 2020
May 2018
March 2020
March 2022
April 2011
May 2018
April 2021
May 2024
April 2023
April 2005
May 2024
November 2014
April 2023
April 2011
October 2006
March 2007
March 2008
September 2007
April 2009
March 2006
October 2006
September 2012
March 2016
September 2004
September 2007
March 2020
May 2024
May 2024
November 2017
September 2012
April 2005
March 2006
March 2006
September 2007
March 2008
September 2007
April 2021
April 2009
October 2010
April 2013
April 2013
October 2019
March 2022
March 2022
March 2022
May 2024
September 2007
March 2008
May 2024
March 2020
March 2016
May 2024
March 2022
April 2023
March 2008
May 2024
May 2024
March 2025
October 2010
April 2010
April 2009
May 2010
March 2008
March 2022
May 2018
December 2013
It is possible to calculate digitally the total area between cliff lines and produce an estimate of land loss, thereby reducing distortions that arise when exceptional losses coincide with sample points. The method is not currently applied on a practical scale.
Cliff line positions from 2018 annually back to 2003 are available at Channel Coastal Observatory (View Layers).
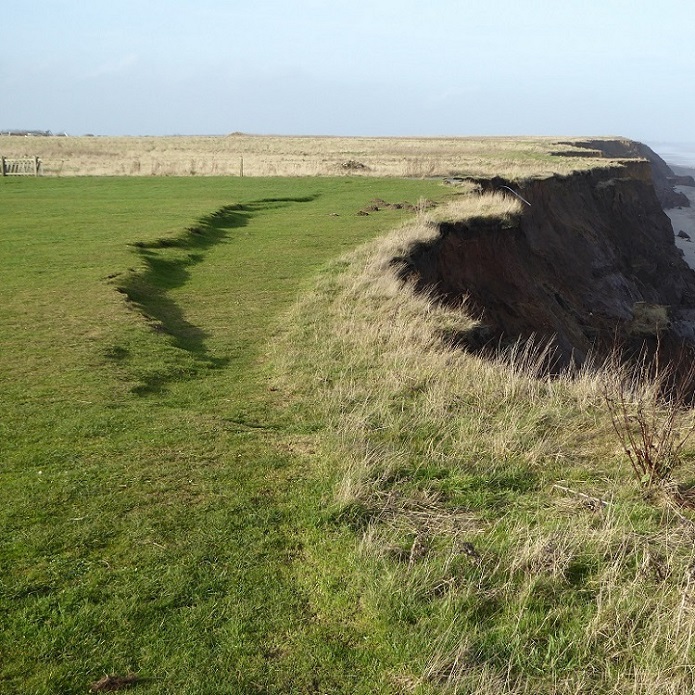
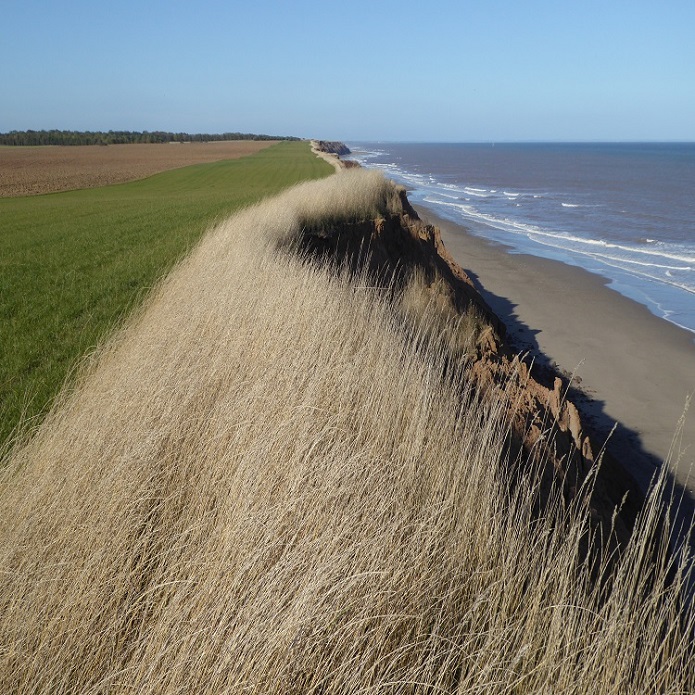
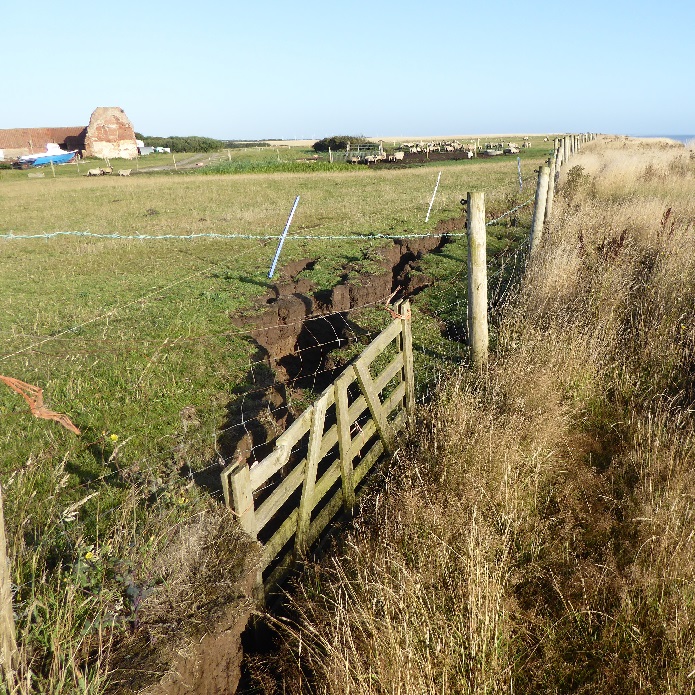
To monitor the cliff line, a surveyor may walk the distance carrying back-pack GPS equipment which continuously records position. The following pictures show some difficulties that can sometimes be encountered.

A new cliff line appears as a slide begins. The emerging cliff edge in the immediate foreground and at the far end of the grassed area is not so easy to determine but may be assumed [Aldbrough: 3 February 2017].

The edge of the cliff is obscured by a previous season’s ungathered crop. Beneath the growth are cracks and an uneven surface which make closer investigation hazardous [Hilston: 22 October 2018].

Although the line of the new cliff is clear, it lies within a fenced area. An inner wire prevents livestock from straying into the crack [Grimston: 20 August 2020].
top
Content by Brian Williams.


