causes and processes  |  galleries  |  data  |  resources

East Yorkshire coastal erosion

land use


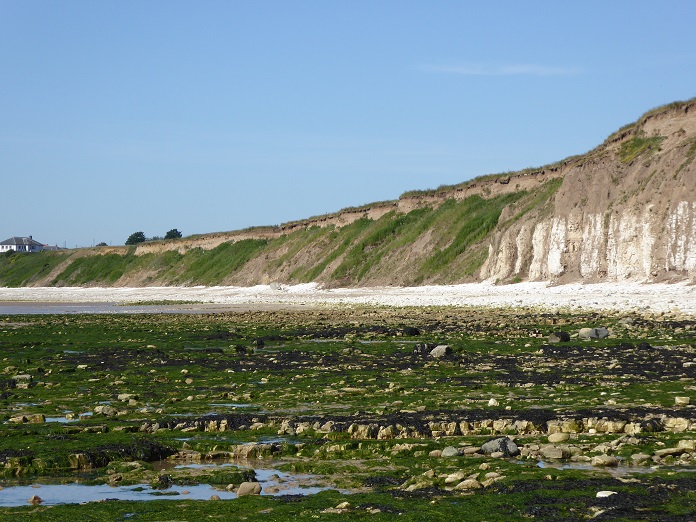
The following table sets out the various types of land use and disuse that border the glacially deposited coastline of the East Riding of Yorkshire, from the ‘buried cliff’ at Sewerby (TA 19876 68485, image) to monitoring profile 122, at the northern end of the Spurn peninsula (TA 42009 14849, image).

Compilation of content is drawn from coordinates (calculation) and aerial imagery (identification and measurement).

Land that lies behind defences is not included in the descriptions. Land use may change, and coastal erosion will alter situations. Whilst every care has been taken in preparation of the data, no liability is assumed.

A. The total length of the coastline including defences is 61,782 metres (61.78 kilometres or 38.39 miles).

B. The total length of unprotected coastline is 51,827 metres (51.83 kilometres or 32.20 miles).

For a north to south listing of instances, see spreadsheet.

smaller screens


description of land use/disuse
defences
agricultural
vacated farm
abandoned farm
abandoned farm and land
site of farm
site of farm (partially lost)
natural
grassed land (part)
open land
open land/dyke
open land inc. lagoons
dunes/lagoons
lagoon
mouth of old access slope
site of sewage treatment works
residential
residential (opposite lost road)
residential/camping
attached to residential
Grimston Garth
commercial
commercial (abandoned)
recreational land
chalet park
chalets
caravan parks
caravan park (abandoned)
caravans/chalets (private)
camping
former airstrip, now camping
beach huts
boat storage
boat club and green
yacht club
golf course
road
road/car park
car park (part) and access
car parking area
hard surface compound
abandoned military site
metres
9955
26528
77
119
542
165
163
1521
168
3369
205
815
2005
212
62
140
1147
145
50
68
402
116
19
1392
433
123
5795
214
525
25
698
147
409
106
19
555
170
34
331
505
49
2259
% of A
16.11
42.94
0.12
0.19
0.88
0.27
0.26
2.46
0.27
5.45
0.33
1.32
3.25
0.34
0.10
0.23
1.86
0.23
0.08
0.11
0.65
0.19
0.03
2.25
0.70
0.20
9.38
0.35
0.85
0.04
1.13
0.24
0.66
0.17
0.03
0.90
0.28
0.06
0.54
0.82
0.08
3.66
% of B
 
51.19
0.15
0.23
1.05
0.32
0.31
2.93
0.32
6.50
0.40
1.57
3.87
0.41
0.12
0.27
2.21
0.28
0.10
0.13
0.78
0.22
0.04
2.69
0.84
0.24
11.18
0.41
1.01
0.05
1.35
0.28
0.79
0.20
0.04
1.07
0.33
0.07
0.64
0.97
0.09
4.36
 

top


Page prepared by Brian Williams in November 2024.