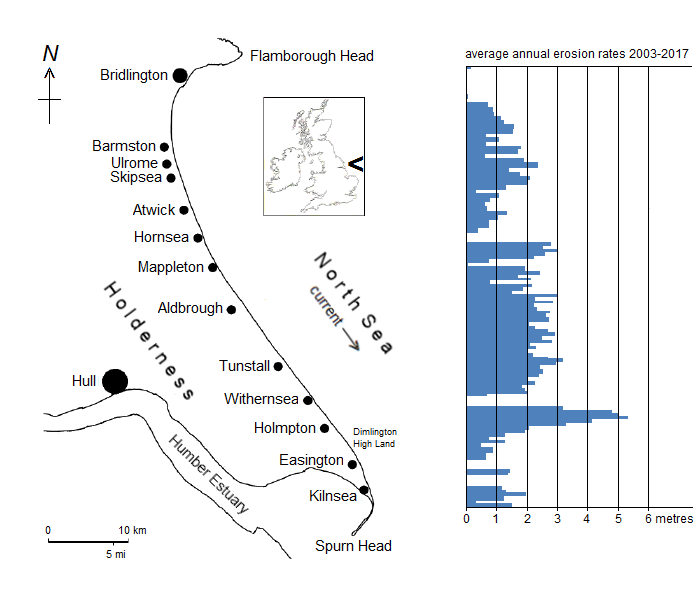
The cliffs of the East Riding of Yorkshire, where the plain of Holderness meets the North Sea, provide an example of coastal erosion on an observable scale. Although the situation can vary considerably from place to place, from year to year, and within the year, the overall loss of land through cliff recession along this coast is often quoted as being one of the fastest in Europe.
On the chart, erosion rates covering a period of fifteen years are shown opposite the locations to which they relate.

The outline map shows the administrative coastline of the East Riding of Yorkshire. Cliffs that are the subject of this and related pages extend from just north of Bridlington down to Spurn. The district of Holderness begins south of Skipsea. Both the contraction East Yorkshire and the name Holderness are widely used when referring to the coastal area in general.
In order to understand the reason for such rapid erosion it is necessary to travel back in time, to what is generally known as the ice age.
An ice age is not a single event that comes and goes but consists of major advances and retreats, with fluctuations, oscillations, and with prolonged periods of little change. Individual events are measured in thousands or tens of thousands of years.
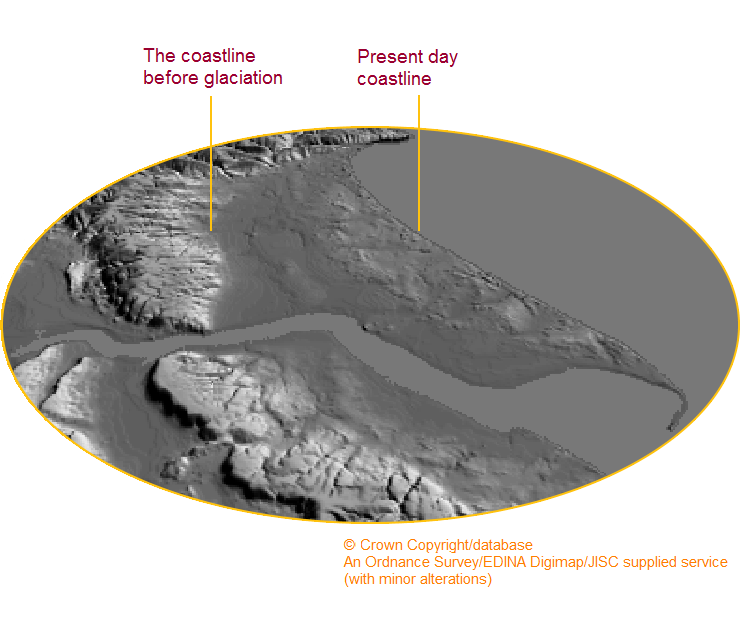
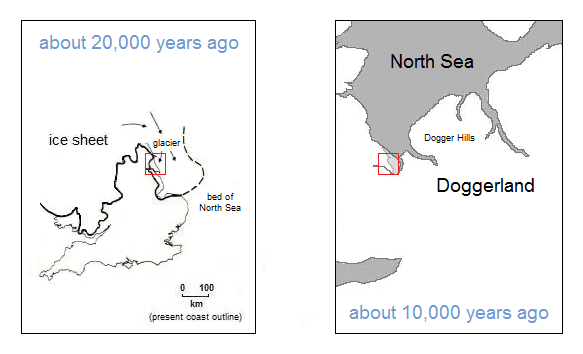
During the most recent advance, a lobe of ice crept south along the drained bed of the North Sea at the east of England (global sea levels were low because of the volume of water bound up in ice sheets). The coastline around the mouth of the Humber was determined at the time by the outcropping of a great thickness of chalk that underlies the North Sea basin.

The glacial body grew and expanded laterally, extending as far as the chalk cliffs, where the higher ground stopped a further spread of ice. Temperatures eventually rose and the ice began to melt. A vast amount of material picked up and carried within the ice, or pushed by it, was left behind. Geologists refer to material deposited in this way as ‘till’, once called boulder clay.
Between present-day Britain and mainland Europe lay Doggerland. Over the course of a few thousand years, as meltwater released from ice sheets allowed sea levels to recover, the post-glacial territory was eroded and inundated. The process was also doubtlessly hastened at one stage by a massive tsunami resulting from an underwater landslide off the coast of Norway.
An inlet appeared between the east coast and the Dogger Hills (now submerged as the Dogger Bank). If a start to the story of East Yorkshire’s coastal erosion is required, then the broadening of that sea inlet would serve. In the soft tills of Holderness, essentially a remnant of Doggerland, the North Sea continues to regain its earlier domain.

Land will be consumed at a significant rate for as long as the tides are able to wash against the foot of an unprotected cliff. At current erosion rates, and with no other influences, the sea will reach the former cliffs of chalk in about 10,000 years.
Localised cliff failure can result from a number of causes. On the scale of the coastline as a whole, the ever-shifting beach is seen to play a fundamental role. About two-thirds of recorded instances of cliff loss occur where beach level is reduced.
cliffs
erosion in pictures
beach movement
Of 61.8 kilometres of glacially deposited coast, 9.9 kilometres (16.1%) are defended.
In the chart at the top of the page, it can be seen that rates of erosion are higher immediately to the south of Hornsea and Withernsea, places protected by seawalls. The same also applies for other types of defence, at Barmston, Mappleton, and Easington.
Increased erosion occurring downdrift of a protective installation is a product of the terminal groyne effect, in turn a result of longshore drift. The relative softness of the clay and high rates of loss for the East Yorkshire coast offer some textbook examples of the terminal groyne effect.
Another consideration is that the cliffs themselves are a supply of beach material, one that is effectively cut off behind a protective barrier.
Any proposal to limit cliff erosion at a particular location has to be viewed with a mind to cost, typically thousands of pounds per metre for rock armour, and the near certainty that cliff recession will increase elsewhere as a consequence.
Throughout the centuries, land taken by the sea has meant the removal of numerous communities. Names and proposed sites for these are normally presented in map form.
Three glacial tills make up the Holderness Formation.
Resting on the chalk bedrock is the Basement Till. This dates from a glaciation that took place before the one described above. At the coast, which to all intents provides a cross-section through material left by ice, the Basement Till is exposed at Dimlington High Land and occasionally north of Bridlington (it is sometimes called the Bridlington Member).
Skipsea Till, from the most recent glacial period, runs the entire coastline accounting for much of the cliff. Towards the southern end, between Aldbrough and Easington, Withernsea Till sits above the Skipsea Till and for a distance is the dominant member.
Till units, or subdivisions reflecting different phases of deposition, may be visible along the cliff face. Within the tills and between them are pockets and beds of sands, silts and gravels – especially at Dimlington High Land – as well as small and occasionally larger boulders, known as erratics, together with fossil fragments.
The newer tills were created by ice which originated from the north and north-west. It was earlier considered that these were delivered by a composite or two-tier glacier. Both flows would move together, one partially overriding the other. More recently, the prevailing view is that the Withernsea Till marks a slightly later re-advance of ice. An alternative model proposes a continuous glacier moving over a changing land surface thereby picking up different material.

glaciations and tills
Coastal erosion is usually measured by losses at the cliff top, where the impact on agricultural resources, on homes, businesses and amenities, is directly felt.
The earliest Ordnance Survey maps record the coast as it was around 1852. Later surveys allowed for estimation of land loss by comparing changes in cliff line positions.
Actual linear measurement, rather than approximations from maps, became possible in 1951 by the siting of a series of erosion monitoring posts along the coast, with a few more added later.
In 1999, GPS (Global Positioning System) technology was introduced, and readings began at some new locations. GPS was replaced in 2009 by LiDAR (Light Detection And Ranging).
Since 2003, systematic monitoring has been conducted twice a year. Cliff recession is measured along notional lines, or profiles, located at 500 metre intervals along the coastline. Beach contour modelling and continuous cliff line tracing are also carried out.
Some degree of caution is called for when proposing an average rate of erosion. There is wide seasonal and annual variation, and much difference between locations, with a number of erosion hotspots.
The period 2003 to 2024 (22 years) produces an overall average erosion rate of 1.42 metres per year for the entire coastline. When defenced stretches are removed from the total length, the loss of unprotected cliff is 1.67 metres per year.
As regards volume of material removed by the sea, a calculation based on length of unprotected cliff and cliff height suggests that roughly one million cubic metres, weighing perhaps 2.2 million metric tonnes, are lost for every metre of recession along the coast. In fact, tides not only erode the cliff but the beach and sea bed, too. The question of where all the washed away material is deposited awaits a complete answer.
top
data summary
erosion hotspots
all cliff loss data (menu)
Prepared by Brian Williams in December 2011. Last change September 2025.


