East Yorkshire coastal erosion
beach movement
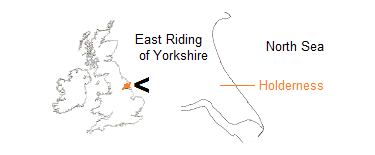
This page presents a model to describe the movement of beach sediment and associated cliff erosion along the glacially deposited coastline of the East Riding of Yorkshire, the greater section of which is known as the Holderness coast.
Material which forms the beach is called beach sediment, a broad term for sand of all grades, for shingle, pebbles, cobbles, and rocks. Sediment is gradually driven down the coast by the action of sea current and tides. It moves not as a whole but in segments, or bodies. Depletion of sediment as one body gives way to another allows waves to reach the base of the cliff more frequently and with greater energy, often creating erosion hotspots.
A main supply of sediment for the East Yorkshire coast enters at the ‘top’, arriving into Bridlington Bay having been brought around Flamborough Head by a sea current flowing north to south. Within the bay are sand banks known as the Smithic Sands, which act as a sediment depository. The bay is subject to a circulatory tidal regime.
Another supply is delivered by the very processes of erosion. The substance of the cliffs originates from the load carried by glaciers that were at a maximum for four thousand years or so (see some basics, also glaciations and tills). At each surface that the ice passed over in its distant journey, grains to rocks of every size would be picked up. Part of the glacial course included the sediment-layered exposed bed of the North Sea.
Nearly a third of eroded cliff material consists of sand and coarse particles. Stones and boulders, called erratics and found in abundance within the tills, are reduced eventually to finer grades once on the beach. The rest is mostly clay, becoming mud and soon washed out to sea.
Sediment spills from the southern end of Bridlington Bay, north of Barmston, where it enters the realm of longshore drift.
The term longshore drift is given to the action by which beach sediment is transported in the direction of the sea current when waves arrive at an angle to the shore. For detail, visit the terminal groyne effect page.
Consequently, an impression may be had of an entire beach slowly working down the coastline as a single entity. In the East Yorkshire situation, this is not altogether the case. As well as longshore drift there is an additional disturbance to sediment.
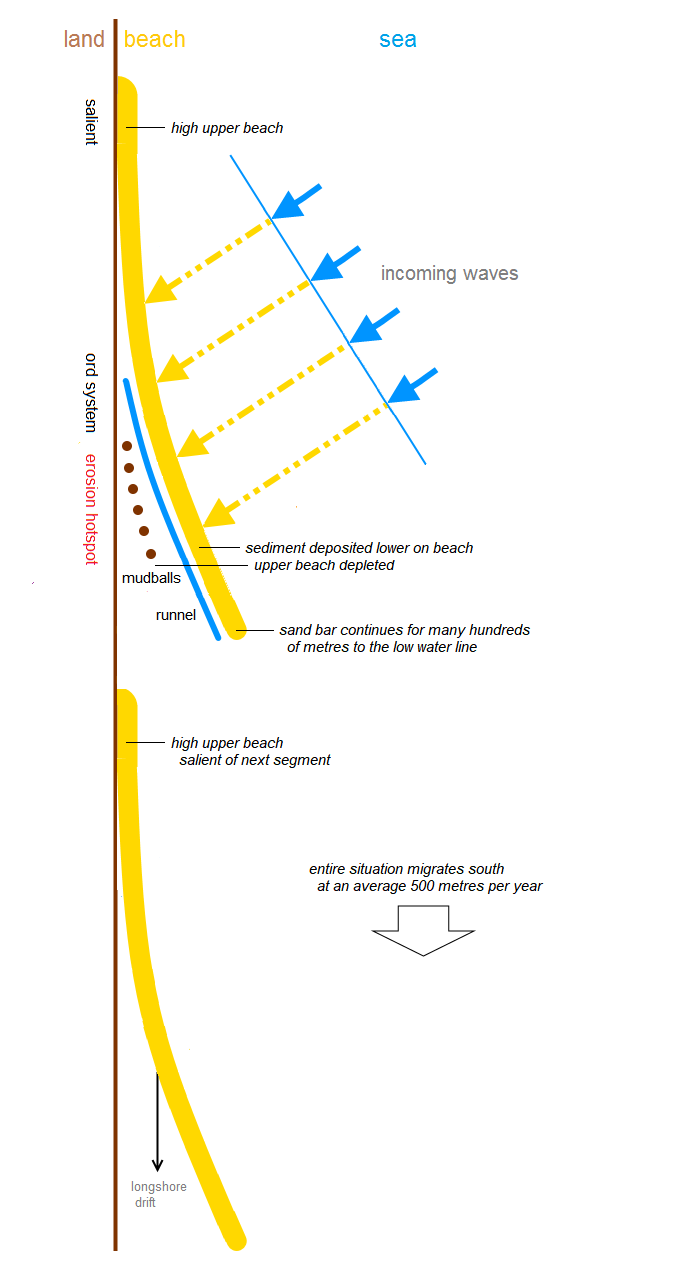
An incoming wave, arriving oblique to the shoreline, deposits sediment within the intertidal zone forming an arrangement that has a seaward tendency, or ‘pull’, north to south.
(For the sake of simplicity, the geometries of refraction, or reduction of a wave’s angle of approach as it enters shallow water, are not included in the above schematic figure.)
Subsequent waves, influenced by the configuration, add more sediment in a manner sometimes referred to as self-organising. A lengthy body of sediment builds, variously called a bank, bar, brow, rib, or ridge.
The sediment body pulls across the beach to the low water line and continues a short way into the water. Wherever such a feature departs the proximity of the cliff, waves are able to carry sediment higher up the beach to create another body.
The beach therefore should not be thought of as a continuous longitudinal expanse but rather as segments, each kilometres in length, moving in sequence.
At the northern end of a sediment segmentation body, sandy material is deposited at and near the foot of the cliff during high energy conditions, raising the level of upper beach to build a ‘salient’ of perhaps hundreds of metres in extent.
Salients offer a certain amount of protection for the cliff against wave action. Quite often, a normal tide is prevented from reaching the cliff.
A salient diminishes as the sediment body pulls away southward to begin a long traverse of the beach to the low water line in the form of a sand bar. More of the cliff base becomes exposed, and the potential for erosion becomes greater.
Since a salient may remain above high water while the associated sand bar is covered during each tide and therefore subject to longshore drift, the two become separated by a ‘stretch’. The slight depression facilitates beach drainage and is normally wet. A subsequent high energy event will renew the configuration.
Previous researchers, notably Ada Pringle and Anne Scott, examined sites of reduced upper beach, where cliff loss is prevalent, referring to the features as ord systems, or ords. The word ‘ord’, spelt ‘hord’ in an 1824 text and once used in local dialect, may be of Old Norse or Danish origin relating to a pointed tip or end.
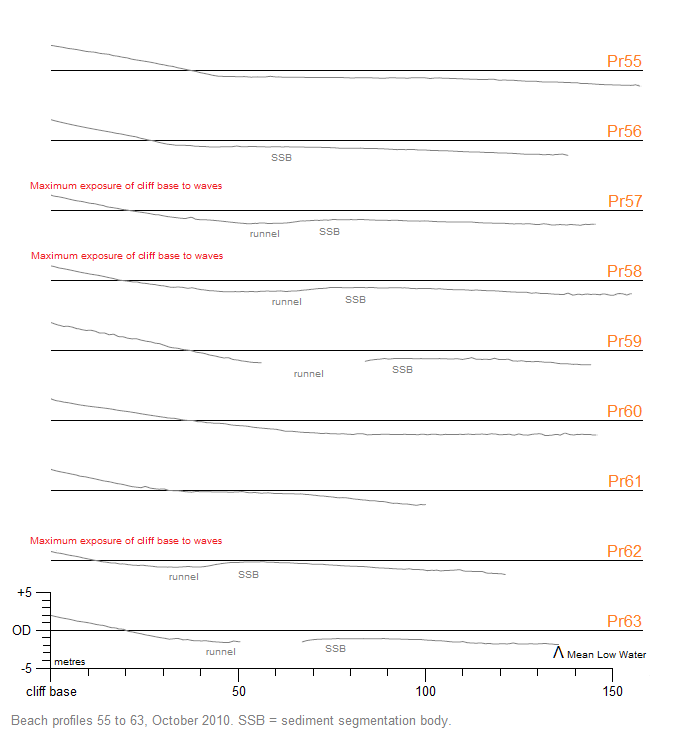
An ord system has characteristic elements. These include a sand bar or ridge at the lower beach, as described above, usually asymmetric in cross section, emerging from the upper beach.
Another element is the runnel, a parallel channel or trough immediately landward of the sediment body, retaining at least for a while water from the last high tide.
There is ordinarily a presence of mudballs, a sure indicator of active erosion.
The most depleted section of upper beach immediately to the south of a salient is regarded as the ord centre. Here, sediment cover is thin or possibly absent altogether from the surface of the clay platform that underlies the beach.
Fine material released from a newly eroded cliff or platform adds little near an ord centre but may well contribute to a downdrift situation.
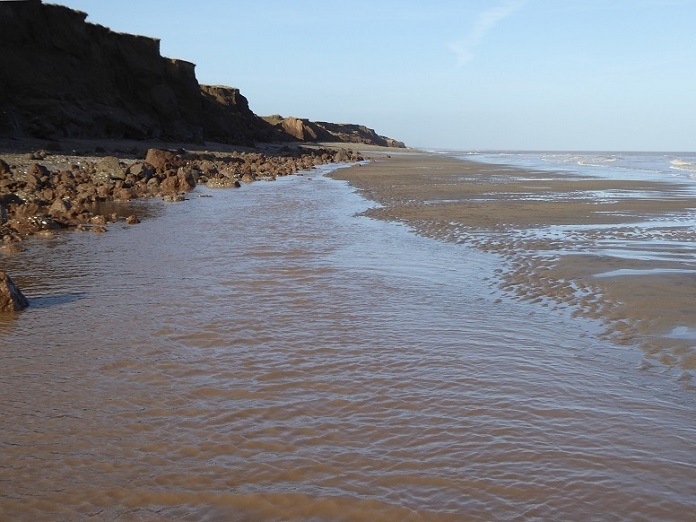

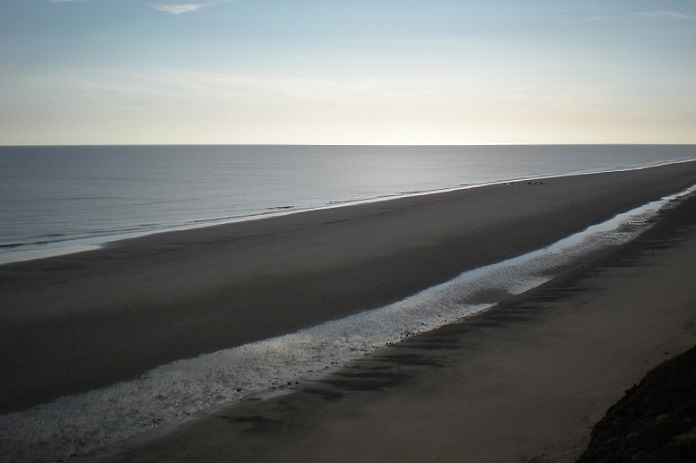
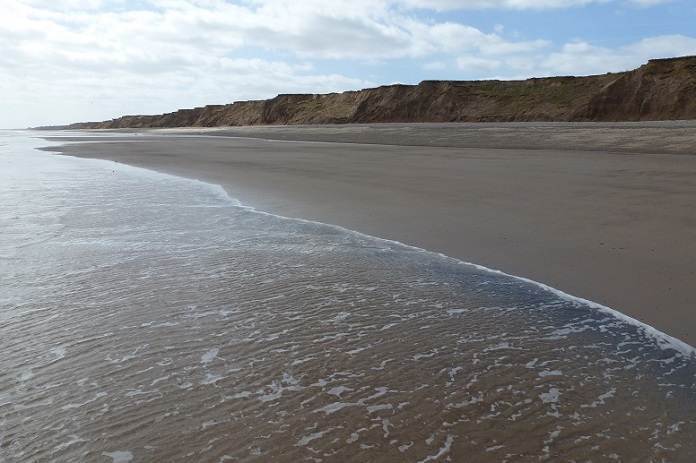
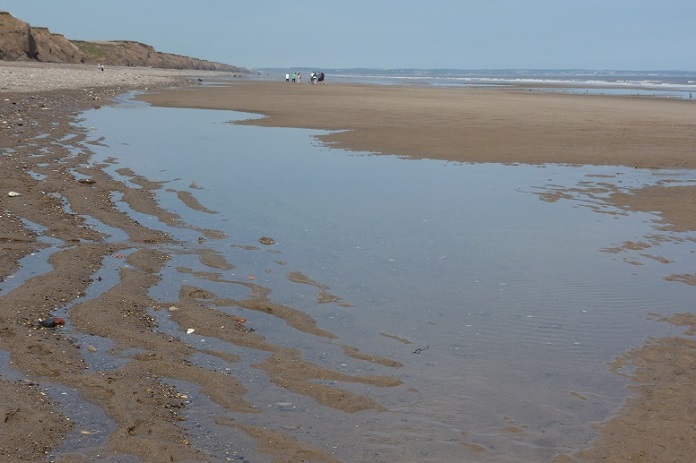
Below, a chart composed of nine consecutive cross-beach profiles represents a distance along the beach of four kilometres, from Cowden to Aldbrough, in units of 500 metres. The vertical scale is approximately twice that of the horizontal.
The distance a sediment body could extend along the beach is essentially determined by the prevailing wave approach angle (WAA). This is the angle an incoming wave makes with the shore and cliff, represented by α (alpha) in the diagram.

Wave approach angle is a product of sea current and tides, and of wind direction, though the wind is a highly variable driver.
Where cliff aligment changes, the wave approach angle will also change. The East Yorkshire coast takes the shape of a long letter ‘S’, occasionally referred to as sigmoid. Angles of wave approach are greater at the curvatures. An increase in the angle means a decrease in segment length.
Along the relatively straight section of coast between Mappleton and Withernsea, a distance of approximately 18.6 kilometres, a deep water wave may approach the coast at an angle of 16 to 18° which, after refraction, makes a breaking wave angle of about 3.5° to the beach.
For the same section of coast, the entire length of a sediment segment beginning at the northern end of the sapient to depth of closure may be around 4.5 kilometres. (Depth of closure is an underwater limit at which surface waves have no influence on sediment.) As regards the subaerial, i.e. what is observable from start of salient to low water mark, an expected length is 3 to 3.5 kilometres, with significant overlap of segments possible.
The early work on ords (see above) crucially included estimates of pace of movement or migration. Calculated from a number of surveys conducted between 1969 and 1983, particularly 1977 to 1983, average migration was put at 496 metres per year.
Variations in pace within a given stretch of coast are essentially determined by wave and wind conditions. During a quiet season there may be little or no discernible movement. Northerly storms tend to produce the most repositioning. In the aforementioned surveys, annual movements range from 5 (five) to 775 metres.
It follows that estimates for the rate of ord movement can be applied to the sediment segments that define ords. Perusal of beach level data collected since 2008 would support the figures.
If an approximation of 500 metres a year is accepted, then sediment segmentation bodies and their associated ord systems migrating south along the East Yorkshire coast take well over a century to complete the journey.
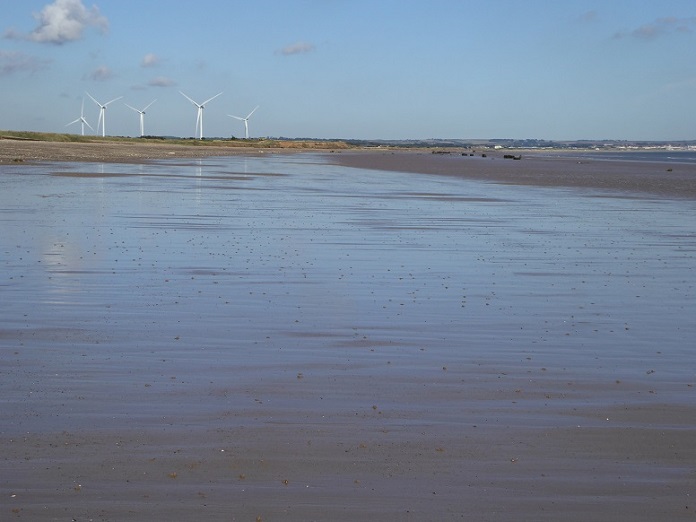
To summarise, a series of sediment segments migrate along the East Yorkshire coast, at an average pace in the order of 500 metres per year. There may be twenty or so such bodies at any one time, with more undergoing formation in the ‘nursery’ of Bridlington Bay, north of Barmston.
Where a segment lies close to the cliff, a sandy salient raises the level of the upper beach, providing a degree of protection from destructive wave energy.
Between salients, especially where the segment pulls away seaward from the cliff (in what is sometimes called an ord system), the upper beach is depleted of sediment cover, allowing waves greater access to the base of the cliff.
The result is a high probability of cliff erosion. As sediment shifts southward, the potential for significant cliff loss follows. Examples of tracking cliff loss migration from data tables appear in the hotspots page.
Since it is the loss of land at the cliff top which impacts on communities and businesses, emphasis tends to be placed on this aspect of coastal erosion rather than what is happening on the beach. See the data in detail page for a background to cliff loss measurement.
By combining data from regular monitoring of cliff recession and surveys of beach contour levels, a relationship between beach movement and cliff loss migration can be demonstrated. Too large to be included here, the graphic presentation is available at migration chart.
top
beach levels and cliff loss
Page prepared by Brian Williams in May 2015. Last content change January 2026.