East Yorkshire coastal erosion
hotspots
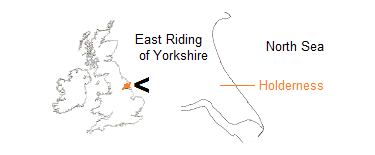
This page considers erosion hotspots in the context of the glacially deposited coastline of East Yorkshire, the greater section of which is known as the Holderness coast.
A coastal erosion hotspot, otherwise written hot-spot or hot spot, may be regarded as a location along a designated stretch of receding coast where cliff loss is reliably measured over a given time as being significantly above the average for that length of coast.
Any natural or human action that brings about a local reduction in beach level is almost certain to produce an erosion hotspot. Two processes can be observed to do this. Different in origin, one static and the other dynamic, they sometimes act together.
1. terminal groyne effect
The construction of defences against the sea in order to combat erosion invariably results in an increase in the rate of cliff loss downdrift of the installation. This is called the terminal groyne effect (TGE) or terminal groyne syndrome (TGS). Hotspots so caused are associated with particular locations.
For a detailed explanation, go to the terminal groyne effect page.
2. beach movement
Material which forms the beach is called beach sediment, a broad term for sand of all grades, for shingle, pebbles, cobbles, and rocks. Sediment is gradually driven down the coast by the action of sea current and tides. It moves not as a whole but in segments, or bodies.
Depletion of sediment as one body gives way to another allows waves to reach the base of the cliff more frequently and with greater energy, often creating erosion hotspots. These hotspots move, or migrate, at the same southward pace as that of the sediment.
For a detailed explanation, go to the beach movement page.
Cliff loss along the East Yorkshire coast is monitored at regular intervals. By making use of the data collected, hotspots can be tracked. Below are some examples.
Tables display cliff loss in metres. Cells are colour graded – the darker the fill the greater the erosion.
For sets of data, go to data menu.
For places and profiles, go to monitoring locations.
◀ smaller screens ▶
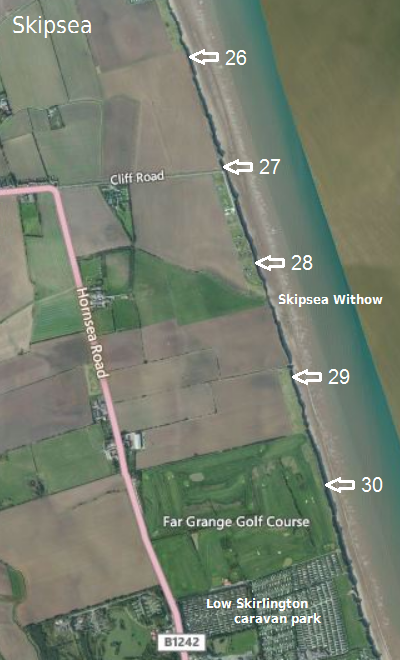
Shown on the map is the stretch of coast south of Skipsea towards Skirlington, passing Skipsea Withow SSSI (Site of Special Scientific Interest). Arrows indicate where monitoring profiles 26 to 30 intersect the cliff line, at 500 metre intervals.
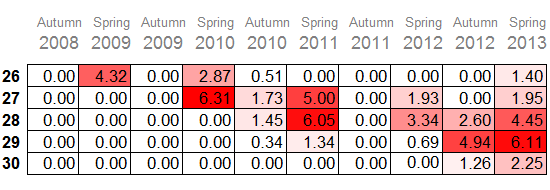
It can be seen from cell shading in the table how exceptional cliff recession – that is, a hotspot – has migrated southwards along the coast, at roughly half a kilometre per year, over a five year period.
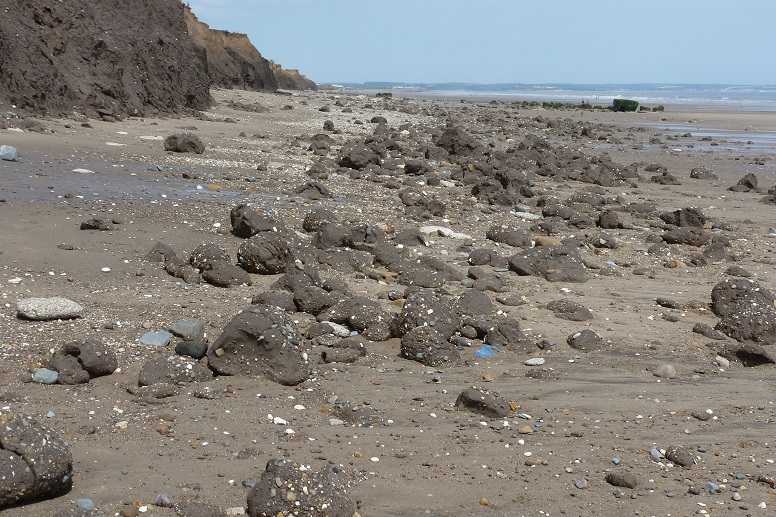
A visual idea of the erosion process may be gained from the opening trio of pictures at the Skipsea Withow page, taken close to the Profile 27 intersect, and from the image below, where mudballs and a thin beach just south of the Withow site indicate high erosion activity [26 May 2013].
In a table prepared for a hotspot study, cells containing values track the migrationary course of a dynamic erosion hotspot which begins to the south of the Hornsea defence system, later to traverse the defences at Mappleton. Both these locations are affected by the terminal groyne effect, a cause of static erosion hotspots.
Blank white cells denote that no loss is recorded. Cells having a pale blue fill mark the paths of two other hotspot migrations, one preceding and the other following the subject. For clarity, values for these are omitted.
Average annual loss at undefended cliffs for the coast as a whole over the fifteen year period 2003 to 2017 is 1.73 metres (approximately 0.56 metres for autumn and 1.17 metres for spring).
◀ smaller screens ▶
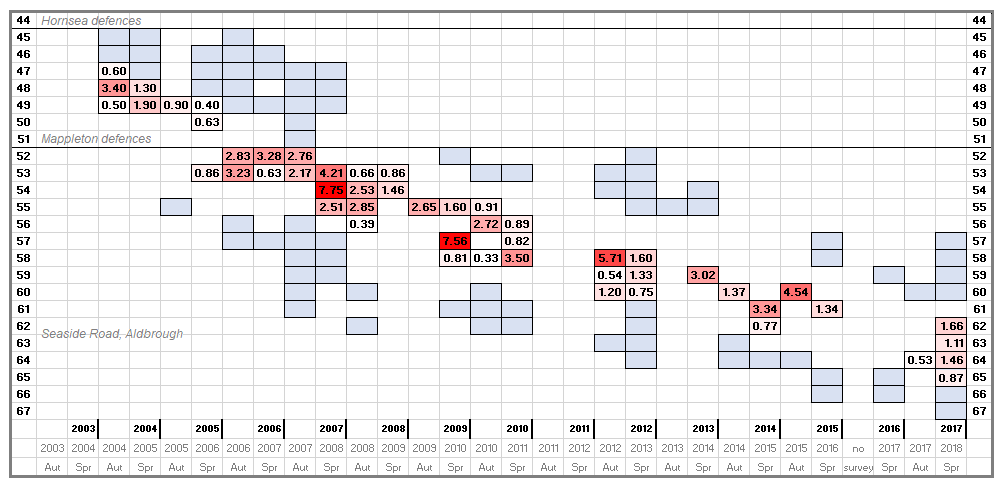
For an update, go to spreadsheet.
A further example of hotspot movement is captured in the following table.
The path of severe cliff loss is imprinted across twenty seasons (ten years) as it travels five kilometres from the now truncated Pastures Lane, Tunstall (Profile 79), across Sand le Mere (profiles 82 to 84) and Waxholme (profiles 86 to 87), to approach the Withernsea defences.
Evidence of the course of two other movements appear in the table. From a fixed point at the cliff top, high rates of recession are perceived to occur in cycles.
◀ smaller screens ▶

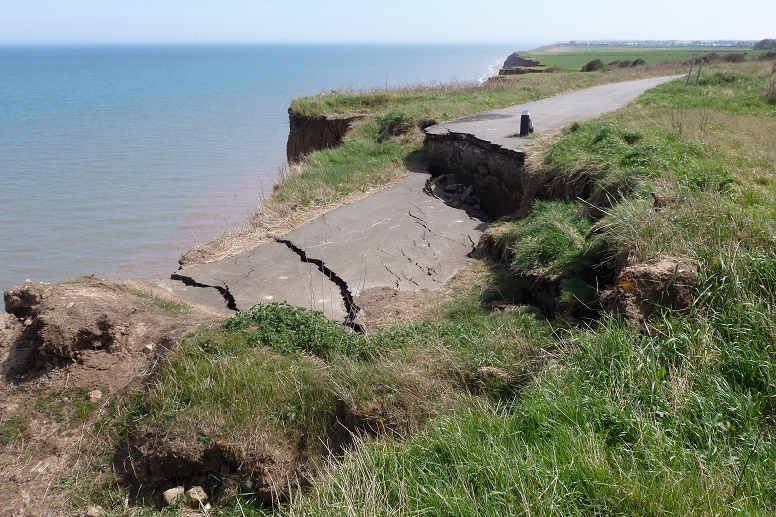
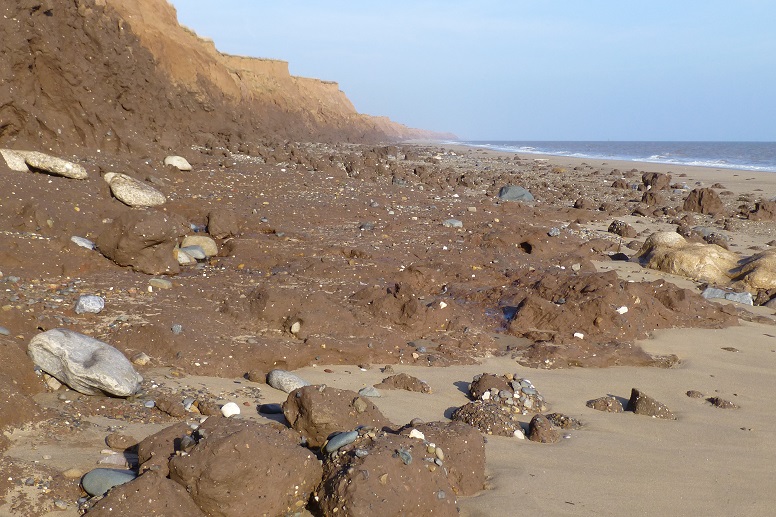
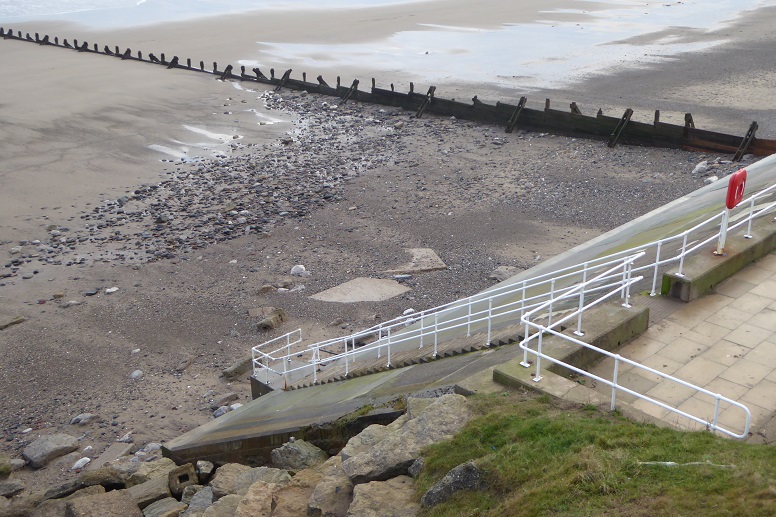
The first of two tables presents cliff loss data for the decade autumn 2004 to spring 2014. Losses of magnitude are indicated within the upper half of the table, and hotspot movement can be traced without difficulty. Conversely, the lower half tells of little erosional activity over the period.
◀ smaller screens ▶
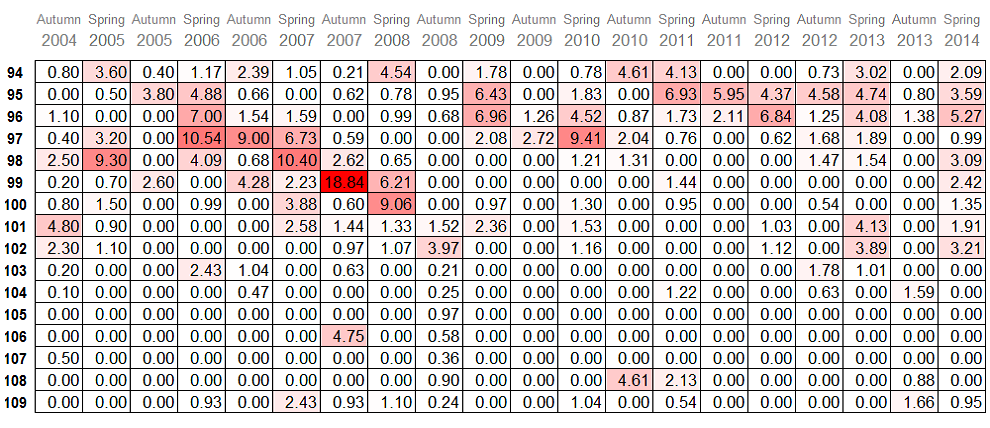
A second table shows data for the subsequent ten years, from autumn 2014 to spring 2024. Again, large losses are noted south of Withernsea. (Profile 94 became redundant on completion in 2020 of the latest extension to the defences.) During this period, some substantial cliff loss is apparent throughout the rest of the section, too.
◀ smaller screens ▶
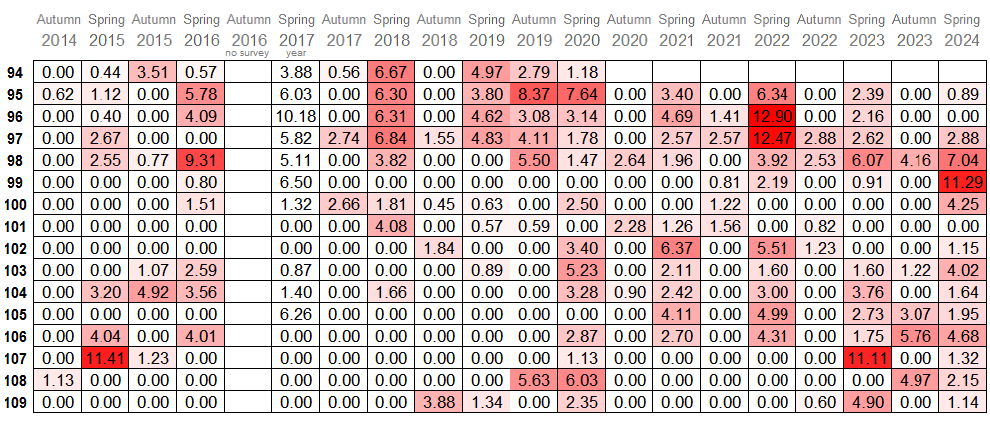
One view is that the volume of sediment released by cliff erosion at Withernsea south, where cyclic dynamic hotspots combine with a static hotspot, was sufficient in the earlier decade to provide some protection further along the coast. In 2005, a 95-metre extension was added to the Withernsea defences (see page), and material released by the terminal groyne effect would have contributed to the downstream sediment budget.
However, such situations are by nature short-lived. ‘Coastal catch-up’ comes into play as equilibrium is restored.
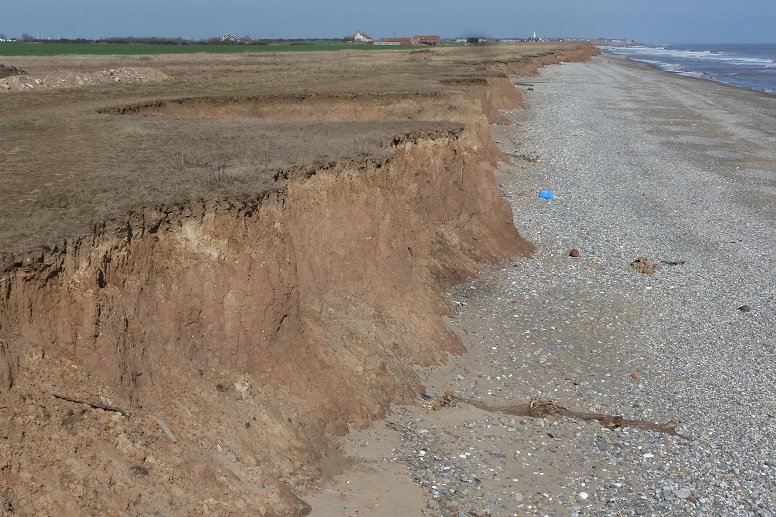
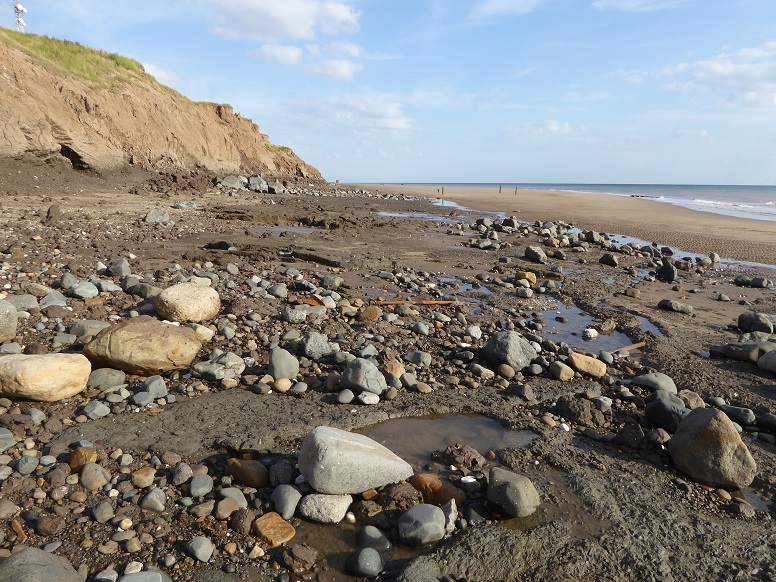
The above methodology and examples would indicate that it is possible to forecast where significant erosion is likely to be observed. Indeed, fieldwork regularly confirms this to be the case.
Limitations apply. Location of likely cliff loss can be projected, but not amount. In a low energy season, there may be no loss at all. On the other hand, a storm surge can involve any part of the coast.
Additionally to influencing the degree of loss, a season’s wind and wave activity will affect the pace at which erosion events move along the coast. Again, a low energy season might cause a temporary stall.
Tracking the movement of hotspots from cliff loss data requires little effort and is reasonably reliable, though it is not the only way. A more process-oriented approach considers the relationship between cliff loss and movement of beach sediment.
For a detailed explanation, go to migration chart.
topPage prepared by Brian Williams in September 2012. Last change June 2025.